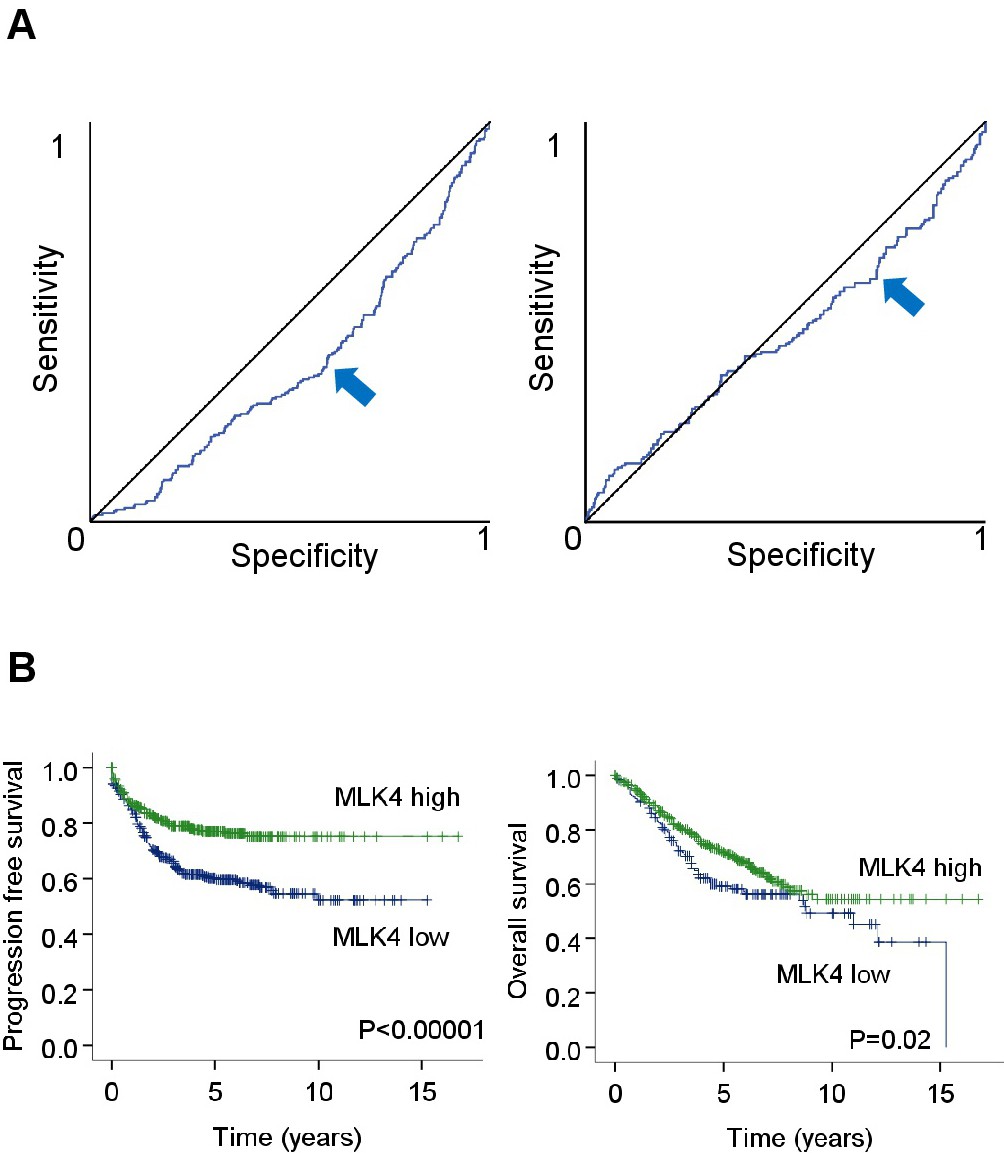
Fig. 3. Significance of MLK4 mRNA expression on progression-free (PFS) and overall survival (OS). (A) ROC curves for determining best discrimination thresholds for MLK4 expression. The arrow indicates the selected sensitivity and specificity cutoff value for binary classification for PFS (left panel) and OS (right panel). (B) Kaplan-Meier plots for PFS in this dataset for MLK4 (cutoff at the normalized expression intensity of 223, left panel) and OS (cutoff at the normalized expression intensity of 189, right panel).